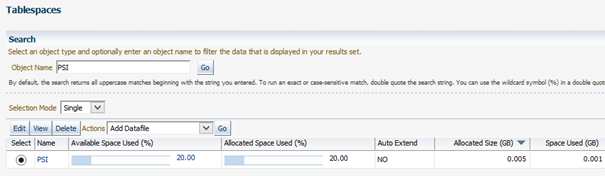
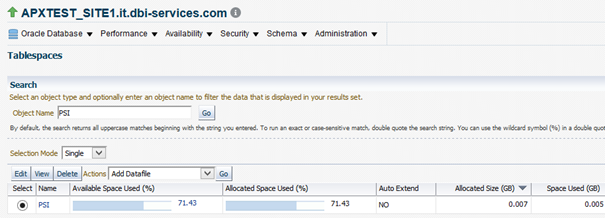
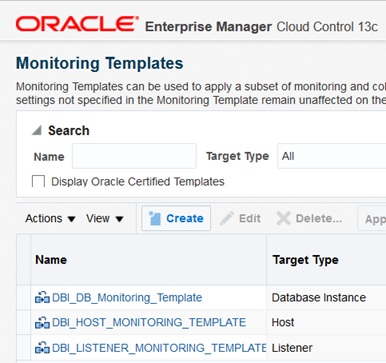
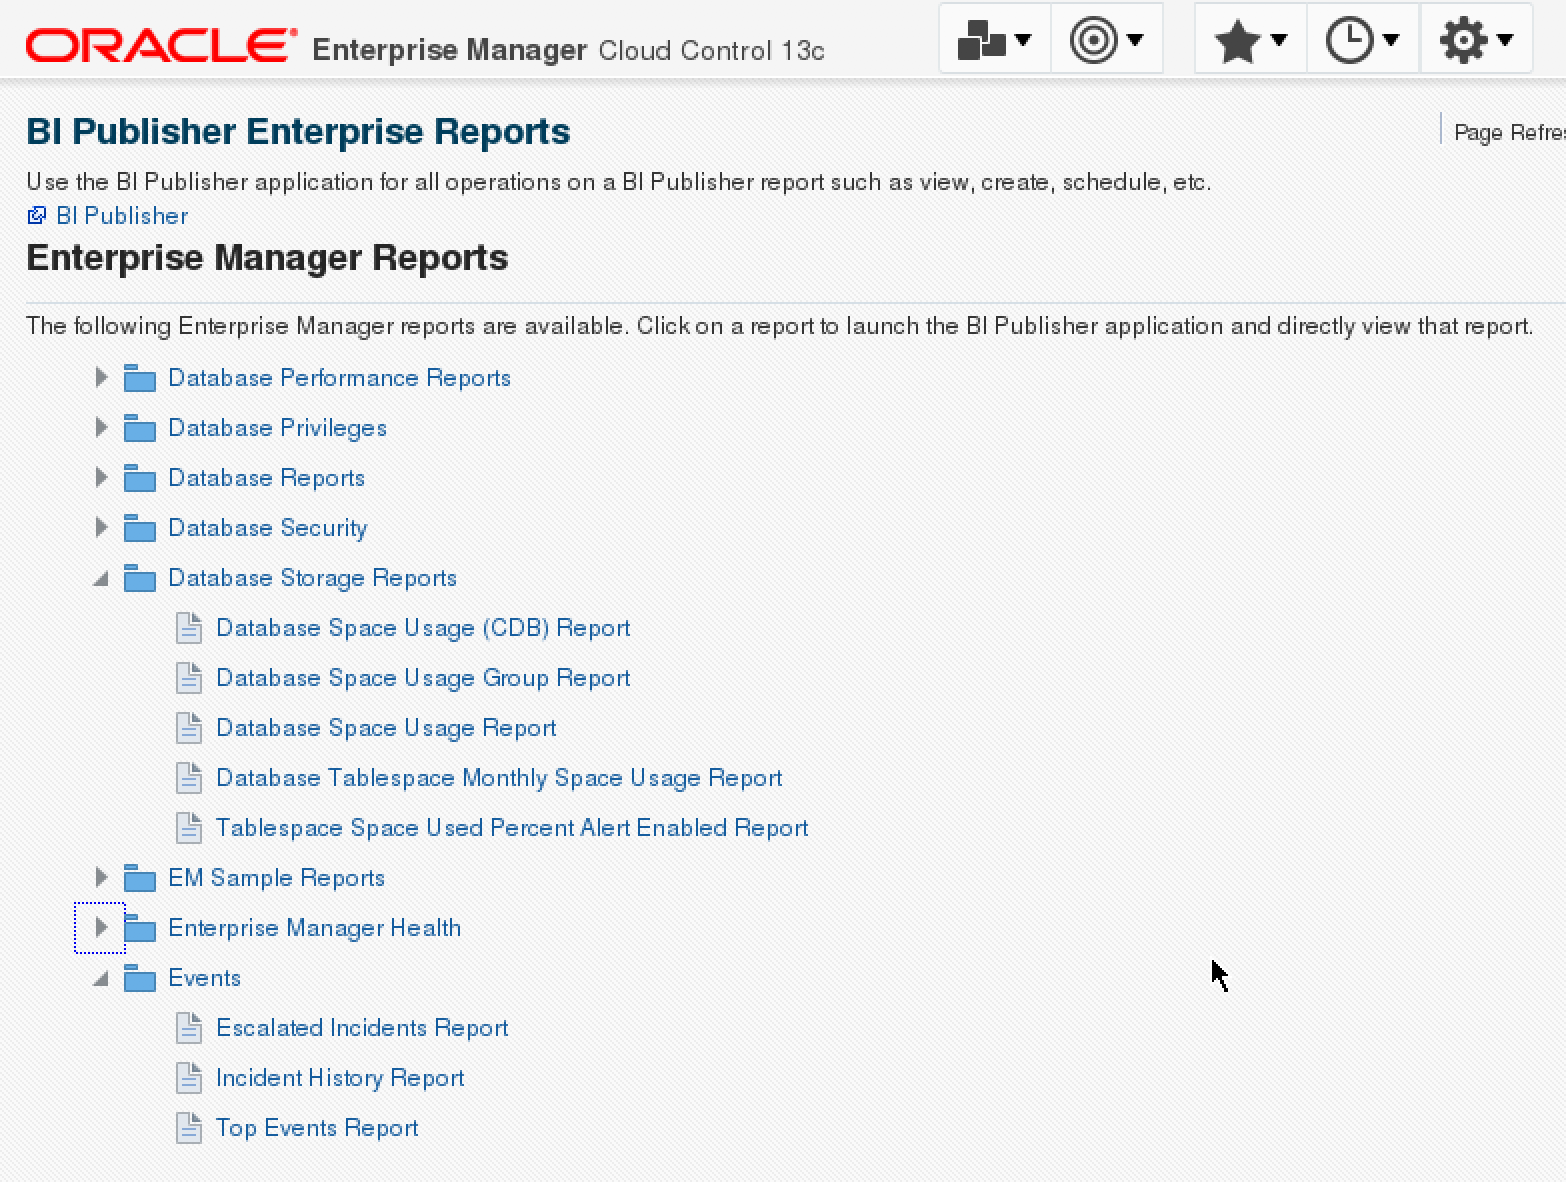
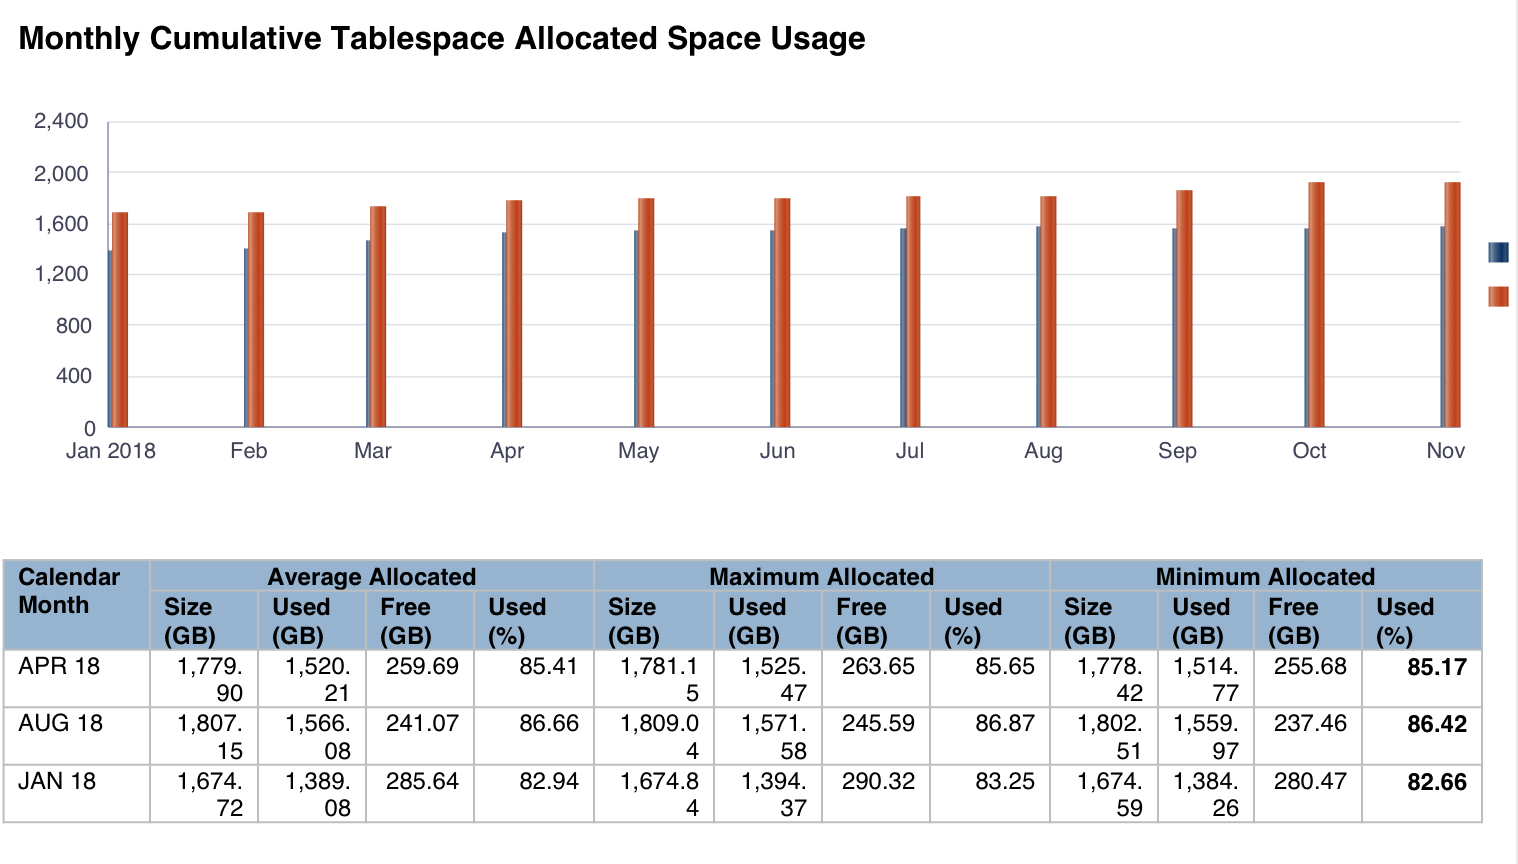
Oracle OEM 13c offers the possibility to generate reports about Oracle Database Tablespace Monthly Space Usage. The displayed information is quite useful and display a lot of information:


The report displays the details for each month and for each tablespace, but the GUI is sometimes painful: you have a nice report but many tablespaces and many numbers :=(
At a client’s site, I had the following behavior: a production database had its data files distributed across three file system /u01 /u01 and /u03. And I wanted to know the evolution of the data files available size for each disk.
My first idea was to write sql requests querying the tablespace history view dba_hist_tbspc_space_usage, but this view does not contain any information about the file system, and as a consequence it is not possible to know how much space will be needed by each file system in the future.
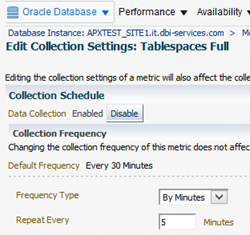
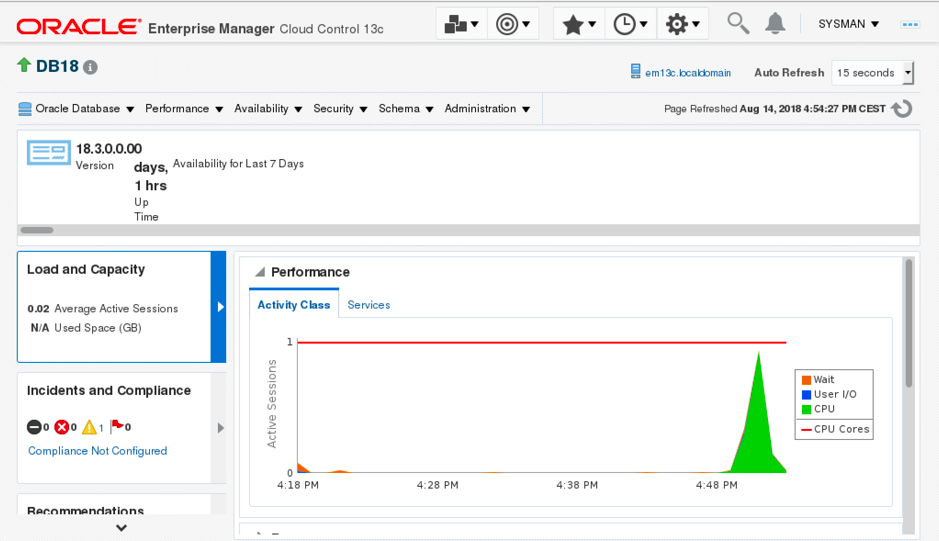
OEM 13c offers the capability of viewing graphs for most of the metrics within OEM, but forecasting and trending capabilities are not present, and most of the category of metrics are set up for real time alerting, not for historical trending.
And I did not find any views like dba_hist_datafiles_space_usage :=)
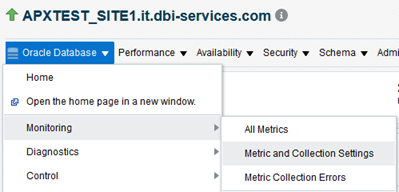
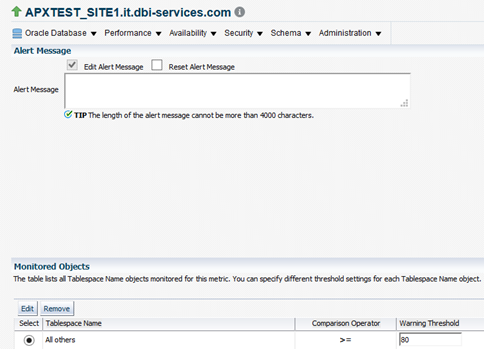
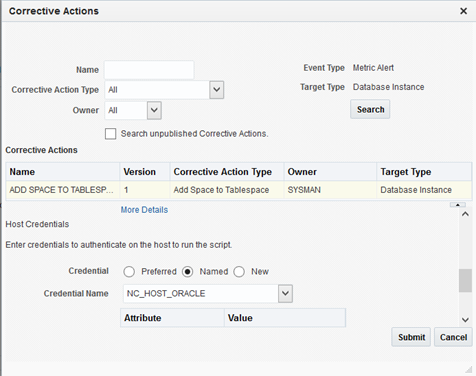
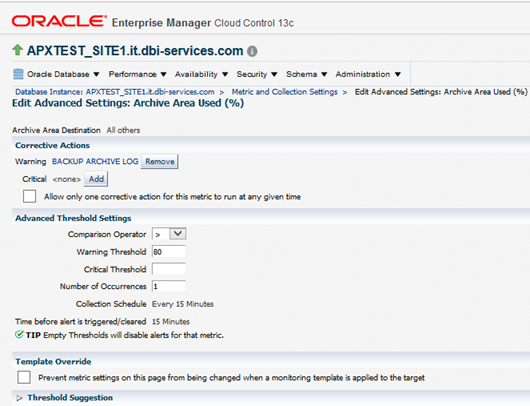
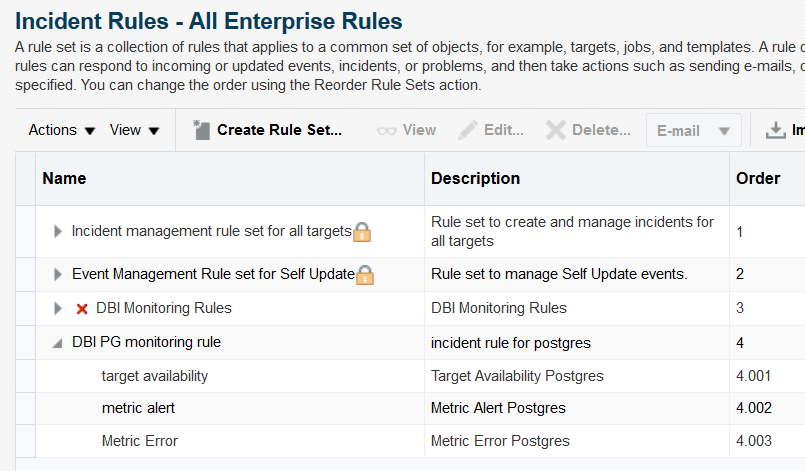
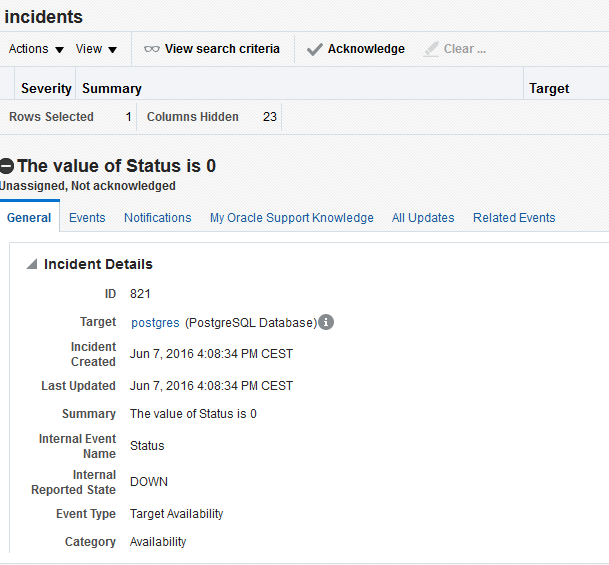
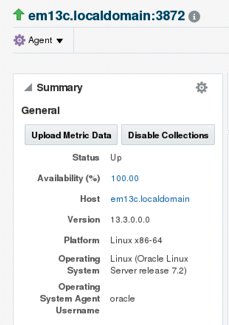
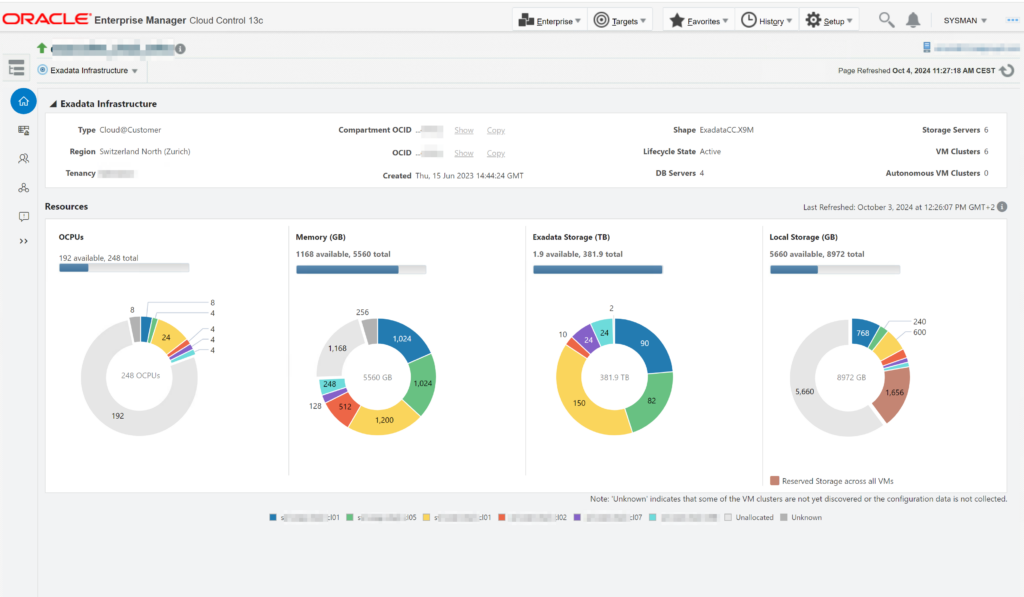
So I checked in EM13c to verify that the file system space usage is correctly monitored. Naturally each file system is monitored and triggers a warning when the available space is below 20%, or a critical alert when it is below 5%.
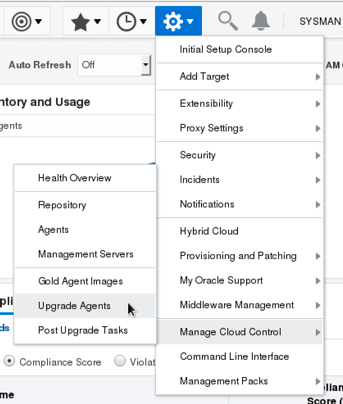
As a consequence I had the idea to query the OEM 13c repository views, and this was the good solution.
At first we can query the mgmt.$alert_current to display the alerts generated on the metric_name Filesystems over target of type host:
SQL> select target_name , target_type, metric_name, metric_column, column_label,alert_state, violation_level
  2  FROM MGMT$ALERT_CURRENT
  3  where metric_name ='Filesystems'
  4  and target_guid in (SELECT target_guid
  5  FROM mgmt$target
  6* WHERE target_type ='host');

em13c.localdomain
host
Filesystems
pctAvailable
Filesystem Space Available (%)
Warning 			20
There is a lot of management repository views providing access to target, metrics and monitoring information stored in the Management Repository. Those views offer the possibility to create your own scripts to query historical data from those views.
In my case I used the gc$metric_values_daily view corresponding to the data in the EM_METRIC_VALUES_DAILY table:
SQL> desc gc$metric_values_daily
 Name					   Null?    Type
 ----------------------------------------- -------- ----------------------------
 ENTITY_TYPE				   NOT NULL VARCHAR2(64)
 ENTITY_NAME				   NOT NULL VARCHAR2(256)
 ENTITY_GUID				   NOT NULL RAW(16)
 PARENT_ME_TYPE 				    VARCHAR2(64)
 PARENT_ME_NAME 				    VARCHAR2(256)
 PARENT_ME_GUID 			   NOT NULL RAW(16)
 TYPE_META_VER				   NOT NULL VARCHAR2(8)
 METRIC_GROUP_NAME			   NOT NULL VARCHAR2(64)
 METRIC_COLUMN_NAME			   NOT NULL VARCHAR2(64)
 COLUMN_TYPE				   NOT NULL NUMBER(1)
 COLUMN_INDEX				   NOT NULL NUMBER(3)
 DATA_COLUMN_TYPE			   NOT NULL NUMBER(2)
 METRIC_GROUP_ID			   NOT NULL NUMBER(38)
 METRIC_GROUP_LABEL				    VARCHAR2(64)
 METRIC_GROUP_LABEL_NLSID			    VARCHAR2(64)
 METRIC_COLUMN_ID			   NOT NULL NUMBER(38)
 METRIC_COLUMN_LABEL				    VARCHAR2(64)
 METRIC_COLUMN_LABEL_NLSID			    VARCHAR2(64)
 DESCRIPTION					    VARCHAR2(1024)
 SHORT_NAME					    VARCHAR2(40)
 UNIT						    VARCHAR2(64)
 IS_FOR_SUMMARY 				    NUMBER
 IS_STATEFUL					    NUMBER
 NON_THRESHOLDED_ALERTS 			    NUMBER
 METRIC_KEY_ID				   NOT NULL NUMBER(38)
 KEY_PART_1				   NOT NULL VARCHAR2(256)
 KEY_PART_2				   NOT NULL VARCHAR2(256)
 KEY_PART_3				   NOT NULL VARCHAR2(256)
 KEY_PART_4				   NOT NULL VARCHAR2(256)
 KEY_PART_5				   NOT NULL VARCHAR2(256)
 KEY_PART_6				   NOT NULL VARCHAR2(256)
 KEY_PART_7				   NOT NULL VARCHAR2(256)
 COLLECTION_TIME			   NOT NULL DATE
 COLLECTION_TIME_UTC				    DATE
 COUNT_OF_COLLECTIONS			   NOT NULL NUMBER(38)
 AVG_VALUE					    NUMBER
 MIN_VALUE					    NUMBER
 MAX_VALUE					    NUMBER
 STDDEV_VALUE					    NUMBER
The main column signification:
| ENTITY_TYPE | The type of the target. Host, oracle_database |
| ENTITY_NAME | The target or component name for example the hostname |
| METRIC_GROUP_NAME | Name of the metric group for example filesystems |
| METRIC_COLUMN_NAME | Name of the metric column for example available, pct |
| KEY_PART_1 | Key part 1 of composite key for example name of the file system |
| KEY_PART_2 | Key part 2 of composite key |
| COLLECTION_TIME | Collection time in target time zone |
| AVG_VALUE | Average value of metric for the day |
| MIN_VALUE | Minimum value of metric for the day |
| MAX_VALUE | Maximum value of metric for the day |
So in my case I only have to execute the following SQL request:
select entity_name,
key_part_1,
collection_time,
avg_value as avg,
avg_value/1000000 as percent  from gc$metric_values_daily
where metric_group_name='Filesystems'
and metric_column_name= 'available'
and key_part_1='/u01'
and entity_name ='oraprod.com'
order by 1,2
/

oraprod.com     /u01          04-OCT-16  169545.44  	.380928435
oraprod.com     /u01          05-OCT-16  169572.44	    .380928435
oraprod.com     /u01          06-OCT-16  169583.44	    .380928435
…
oraprod.com     /u01           17-NOV-18  169538.44 	.172295163
oraprod.com     /u01           18-NOV-18  169538.44 	.172295163
oraprod.com     /u01           19-NOV-18  169525.94 	.172282459
oraprod.com     /u01           20-NOV-18  169498.44 	.172254512
With this result I can easily know how much space is consumed by each file system during the time. We can use Excel’s capabilities to determine the trend of the file system available size.
Conclusion:
We often forget that OEM is not only a graphical administration tool, the main interesting part of OEM is that OEM stores date at regular intervals for important metrics into the management repository. If you understand the management repository views structure, you will have extraordinary possibilities to extract historical data, build graphs in order to analyze more precisely your infrastructure.
Cet article OEM 13c Repository view gc$metric_values_daily est apparu en premier sur Blog dbi services.